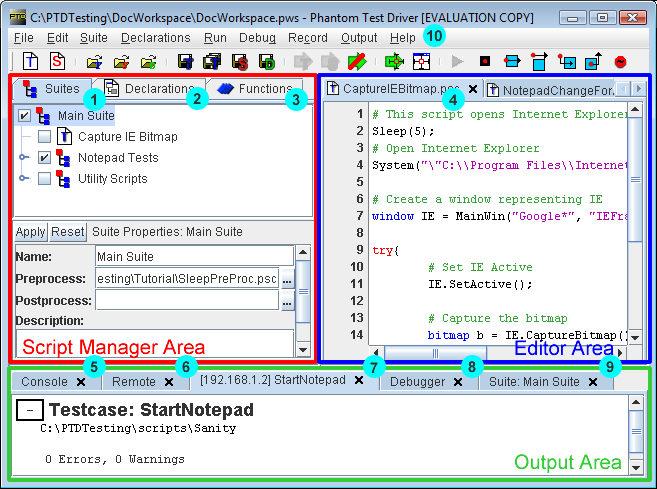
The PTD interface is broken into three primary areas. These areas
are the script manager area, the script editor area, and the output
area.
The script manager area consists of:
1. Suite Viewer - Used to organize and execute groups of scripts as
suites or testcases
2. Declarations Viewer and Editor
- Used to view and edit Window Declarations
3. Function Viewer - Displays a list
of built-in Phantom functions
The script editor (4) consists of any number of tabs with open scripts.
The script editor works with the Declarations Viewer and Function
Viewer to support drag-and-drop functionality. This allows functions
and declarations to be added to a script by simply clicking the item
and dragging it to the script.
The output area can have several different types of windows:
5. The Console - Used for real-time Phantom
commanding
6. Remote Execution Manager - Used
to manage remotely executed scripts
7. Script or Suite Output - Displays output
from a script or suite (9) run
8. The Debugger - Used for debugging scripts
Note that only the Console appears when PTD is first opened. The rest
may appear depending what actions are performed in PTD (for example,
debugging a script will open the debugger, and running a script will
open an output window).
Additionally, many menu selections (10) are available to access the
functionality of PTD. For a list of menus, see the Menus
section.
An image of the main PTD interface with the major components labeled
is below.

