This tutorial will illustrate how to use PTD's built-in Phantom
script debugger. It assumes that the tutorial
on creating and running Suites and Testcases has been completed.
The Phantom Script Debugger is a useful
tool for developing scripts. It can be used to run a script and control
the execution of the script. It can also be used to monitor changes
to the variables in a script.
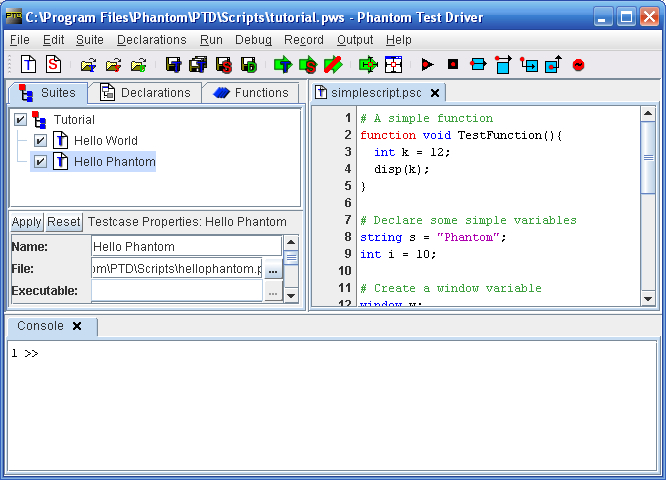
Open the 'simplescript.psc' script file. The file is located in the
'scripts' directory under the PTD installation directory. A simple
script is opened with a simple function, some variables, and a simple
'for' loop. This script will be used with the debugger to illustrate
the use of the debugger.

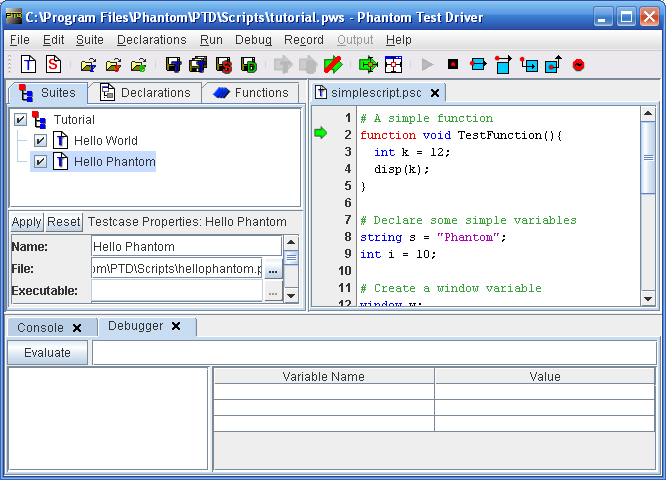
To start the debugger, select the 'simplescript.psc' tab in the editor
window and select 'Start' from the 'Debug' main
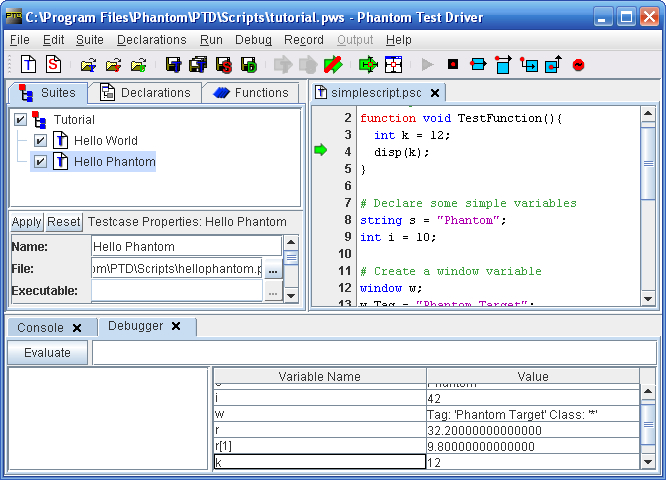
menu. The debugger tab is opened automatically in the output area
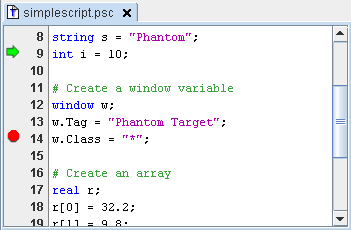
of PTD, and a small arrow ( )
appears in the line number section of the script. The arrow indicates
the line which is about to be executed by Phantom. The script execution
is paused at this time, waiting for user input on how to proceed.

Pressing the 'F10' key, or selecting 'Step Over' from the 'Debug'
main menu, will cause Phantom to take one
execution step. Execution steps are steps processed by the Phantom
interpreter. Therefore, comments are skipped, and function definitions
are skipped. Additionally, any lines that are not executed as a result
of a Phantom flow control statement are skipped. Press 'F10' to perform
one step.

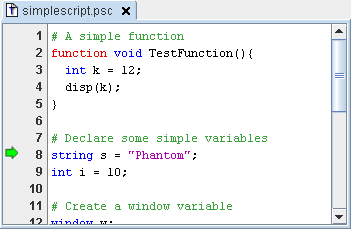
Phantom processed the declaration of the TestFunction function and
proceeded to the next executable line (string s = "Phantom";). This
next line will create and define a string variable named 's'. Variables
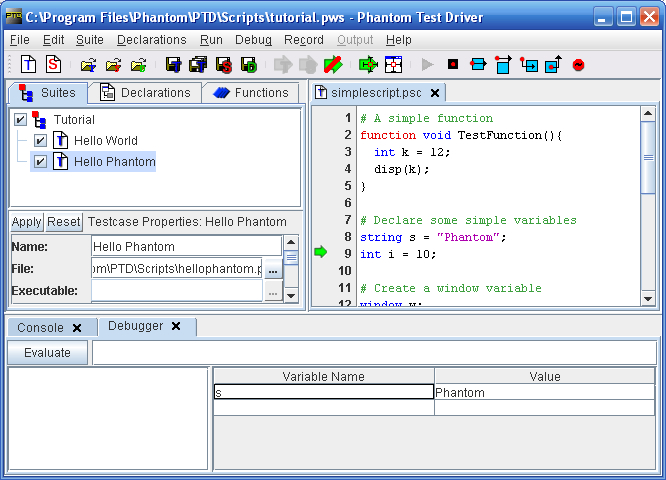
can be viewed during debugging by entering the variable name in the
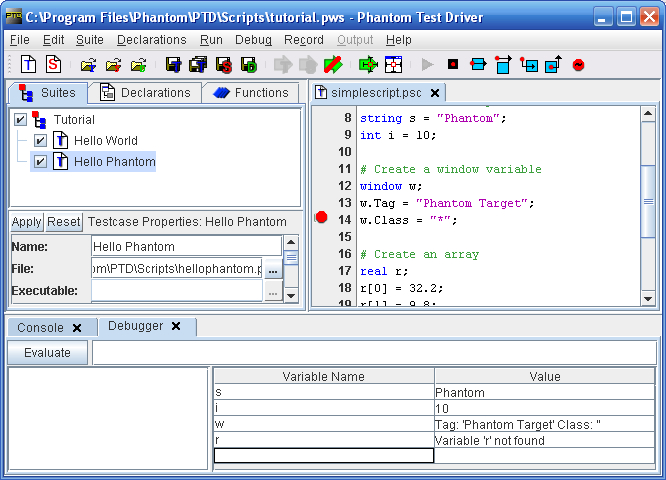
'Variable Name' column in the debugger window. Click the first empty
name in the column, input 's' and press 'Enter'.
The 'Value' column displays the value of a variable. Since the variable
does not exist yet (Phantom has not yet processed that line), the
value is 'Variable 's' not found'.

Press F10 again and the Phantom Script will process the current line
and the variable 's' will be created. Note that the value changes
to 'Phantom' - the contents of the string 's'.

Script execution can continue in this way, pressing F10 until the
script is finished. However, it is often easier to set breakpoints
to automatically stop script execution. To set a breakpoint, click
on the line number where the execution should stop. Remember, this
should be a line that Phantom will process (no comment or empty lines).
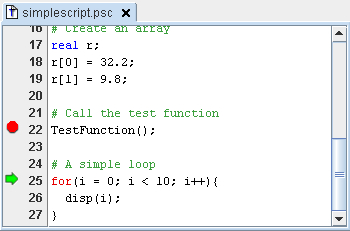
Click the line number next to the 'w.Class = "*";' line.

A new breakpoint has now been added, and a red circle ( )
has appeared next to the line number. To remove a breakpoint, click
the red circle. For the time being keep the breakpoint just created.
Before continuing, add three new variables to the variable watch list:
'i', 'w', and 'r'. These values will be set as execution progresses.
If there are not enough rows, select the last row and hit 'Enter'
and a new row will appear.

To continue script execution without performing individual steps,
use the 'F5' key or select 'Continue' from the 'Debug' main
menu. The 'Continue' command will cause Phantom to continue executing
commands until either a breakpoint is reached or the script is finished.
After hitting 'F5', notice that the script has stopped at the breakpoint
created earlier (the arrow is behind the red circle). Also notice
that the values of the 'i' and 'w' variable have been filled in.

Any Phantom command can be executed manually during a debug session.
While execution is paused on a line, enter a command in the field
next to the 'Evaluate' button and then click 'Evaluate' (or hit 'Enter').
The new command is processed immediately by Phantom as though it were
part of the script. Enter 'i = 42;' in the Evaluate field and press
'Enter'.

Notice that the 'i' value in the variable watch section changed to
42. In this way, variable values can be set for script testing purposes
and any other Phantom command can be run.
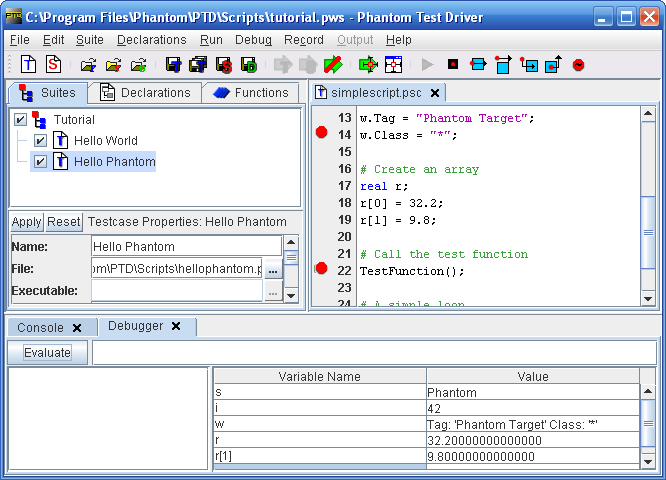
Add a new breakpoint next to the 'TestFunction();' line and continue
script execution (F5). Notice that now the value for 'r' is available,
since r was created and defined. However, only the first value in
the 'r' array is visible. To view other elements, the index must be
added like any Phantom array.
Enter a new watch variable with the name 'r[1]'. This will display
the second element of 'r' (recall that array indices are zero based).

Script execution is now paused at the 'TestFunction();' function call.
Pressing F10 would execute the function and move to the next line.
However, if execution should proceed to the first step *inside* the
function, the 'Step Into' command should be used from the 'Debug'
menu (or press F11). This will cause Phantom to move to the first
step inside the function. Alternatively, a breakpoint could be set
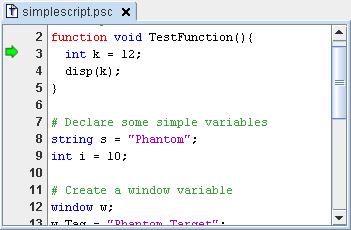
inside the function. Press F11 and the script should move to the first
executable line inside the function ('int k = 12;').

Now any variables created inside the function will be available. Insert
a new watch variable called 'k'. Currently it has no value. Press
F10 to continue one step, and the 'k' value will be shown.

To exit a function without stepping all the way through, use the 'Step
Out' command from the 'Debug' main menu (alternatively, hit 'SHIFT'
and 'F11' concurrently). This will cause Phantom to execute the remainder
of the function and stop at the first line after the function call.
Do this now and notice that the value of 'k' was displayed in the
debugger output and execution has stopped at the 'for' statement after
the function call.

This last section of the script simply illustrates how pressing 'F10'
continuously will follow the script execution through a flow control
statement (in this case a 'for' loop). Press 'F10' multiple times
and notice how the value of 'i' is updated in the variable watch and
is displayed to the output. The loop will continue until 'i' is 9,
then it will stop, and the script will finish.
To stop a script at any time, select 'Stop' from the 'Debug' main
menu.
A Note About Included Scripts
If an external script is used via the 'include' statement (see the
Phantom documentation), F10 will process the entire script. Hitting
F11 will enter the included script (and open it in PTD) similar to
entering a function. If a breakpoint is inserted in an included script,
execution will stop there as with any other breakpoint and PTD will
automatically display the script.
This tutorial has described how to use the PTD debugger.
The debugger can be a valuable asset in developing complex Phantom
automation scripts.
The next tutorial describes
how to use PTD processing scripts.
