PTD contains the ability to debug Phantom scripts. The debugger can
be used to set execution breakpoints, control execution and track
variable changes. To start the debugger, open
a Phantom script. Then select ‘Debug’ then ‘Start’
from the main PTD menu.
When the debugger starts, an arrow ( )
will appear next to the first line of execution. The arrow represents
the line of script that is about to be executed. Additionally, a new
output panel appears:
)
will appear next to the first line of execution. The arrow represents
the line of script that is about to be executed. Additionally, a new
output panel appears:
The following commands are used to control the execution of a Phantom
script during debug mode:
Start (Ctrl+F5): Starts the debugger
Stop (Shift+F5): Stops the debugger
Continue (F5): Continues with execution until the
script is finished or the next breakpoint is reached.
Step Over (F10): Goes to the next line of execution,
stepping over any user defined functions. Any functions that are stepped
over are executed fully.
Step Into (F11): Goes in to the user defined function
at the current execution line. Execution stops at the first line of
the user defined function. If no user defined function is called at
the current execution point, then execution proceeds to the next line.
If the file containing a function is not open in PTD, PTD will automatically
open the file. If it is already open, the file will be selected for
viewing.
Step Out (Shift+F11): Continues execution until the
current user-defined function returns. Execution stops at the next
line of the calling script or function, or the next breakpoint, whichever
occurs first. If the current line is not in a user defined function,
continues execution until the script is finished or the next breakpoint
is reached.
Breakpoints
Script execution will automatically stop when a breakpoint is encountered.
Breakpoints can be set on an open script by left-clicking in the number
view column to the left of the script. A red circle ( )
will appear indicating that a breakpoint has been set. To remove the
breakpoint, click on the breakpoint marker. Breakpoints can also be
added and removed using the ‘Toggle Breakpoint’ menu item
under the ‘Debug’ main PTD menu.
Using this menu will toggle the breakpoint state at the line containing
the cursor.
)
will appear indicating that a breakpoint has been set. To remove the
breakpoint, click on the breakpoint marker. Breakpoints can also be
added and removed using the ‘Toggle Breakpoint’ menu item
under the ‘Debug’ main PTD menu.
Using this menu will toggle the breakpoint state at the line containing
the cursor.
Breakpoints are loaded when the debugger starts and execution will
pause automatically when a breakpoint is reached. Breakpoints can
also be added/removed after the execution starts.
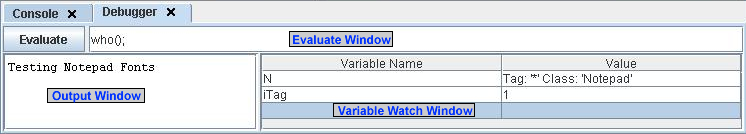
Evaluate
Phantom commands can be run during a debug session. The debugger must
be paused on a line in the script. To run a Phantom command, enter
the command in the evaluate window and click the 'Evaluate' button.
The Phantom command will be executed immediately, and any output will
appear in the debugger output window. Evaluate can be used to change
variable values mid run, add new variables, or perform any other Phantom
function.